Test Linux System Performance using Command Line Tools Part-2
Vmstat
Vmstat command provides a process, memory, page I / O blocks and the monitoring CPU and other information, vmstat can show the average test results or the sample value, sample model can provide a sampling frequency of the monitoring results in different period of time.
PS and Pstree
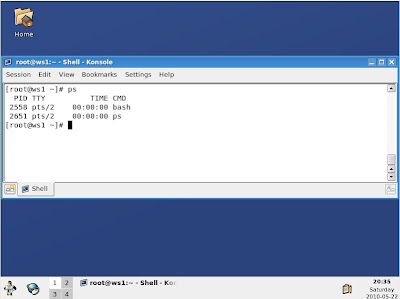
ps and pstree commands are basic commands most commonly used systems analysis, ps command provides a list of running processes, list the number of process parameters depend on additional orders. For example, ps-A command lists all processes and their corresponding process ID (PID).
Using the pstree command displays a tree structure of all the process information and can be integrated child process the information. Pstree command on the source of very useful process.
Free
When using the free command of time, need to remember that linux memory structure and virtual memory management methods, such as restrictions on the number of free memory, swap space in use does not have signs of a memory bottleneck.
Free command useful parameters:
-B,-k,-m-g respectively, and in accordance with bytes, kilobytes, megabytes, gigabytes displayed
-B,-k,-m-g respectively, and in accordance with bytes, kilobytes, megabytes, gigabytes displayed
-L difference between low and high memory display
-C (count) Display the number of free output
Pmap
pmap command shows the process of using one or more the amount of memory, you can use this tool to determine which process on the server takes up too much of memory resulting in memory bottleneck.
pmap command shows the process of using one or more the amount of memory, you can use this tool to determine which process on the server takes up too much of memory resulting in memory bottleneck.


Comments
Post a Comment